- Purpose: To track the ongoing progress of OKRs during a specific period (e.g., weekly, monthly). They are a key tool for tracking progress, identifying potential roadblocks, and ensuring alignment across teams and departments.
- Audience: Team members, managers, and leadership.
-
Content:
- Objective Overview: A summary of each objective and its associated key results.
- Progress Update: Current progress of each key result, usually with numerical percentages or status indicators (e.g., red, yellow, green).
- Achievements: Highlights of what has been accomplished.
- Challenges: Roadblocks or issues encountered that may prevent meeting key results.
- Next Steps: Actions to be taken to get back on track or continue making progress.
Example:
-
Objective: Increase website traffic
- KR1: Increase organic search traffic by 25% (Currently 20% achieved)
- KR2: Publish 15 blog posts (10 published, 5 remaining)
- KR3: Improve site speed (Completed, site now loads 25% faster)
Figures 5.1 and 5.2 capture reports on goals and key results progress in OKR implementations:
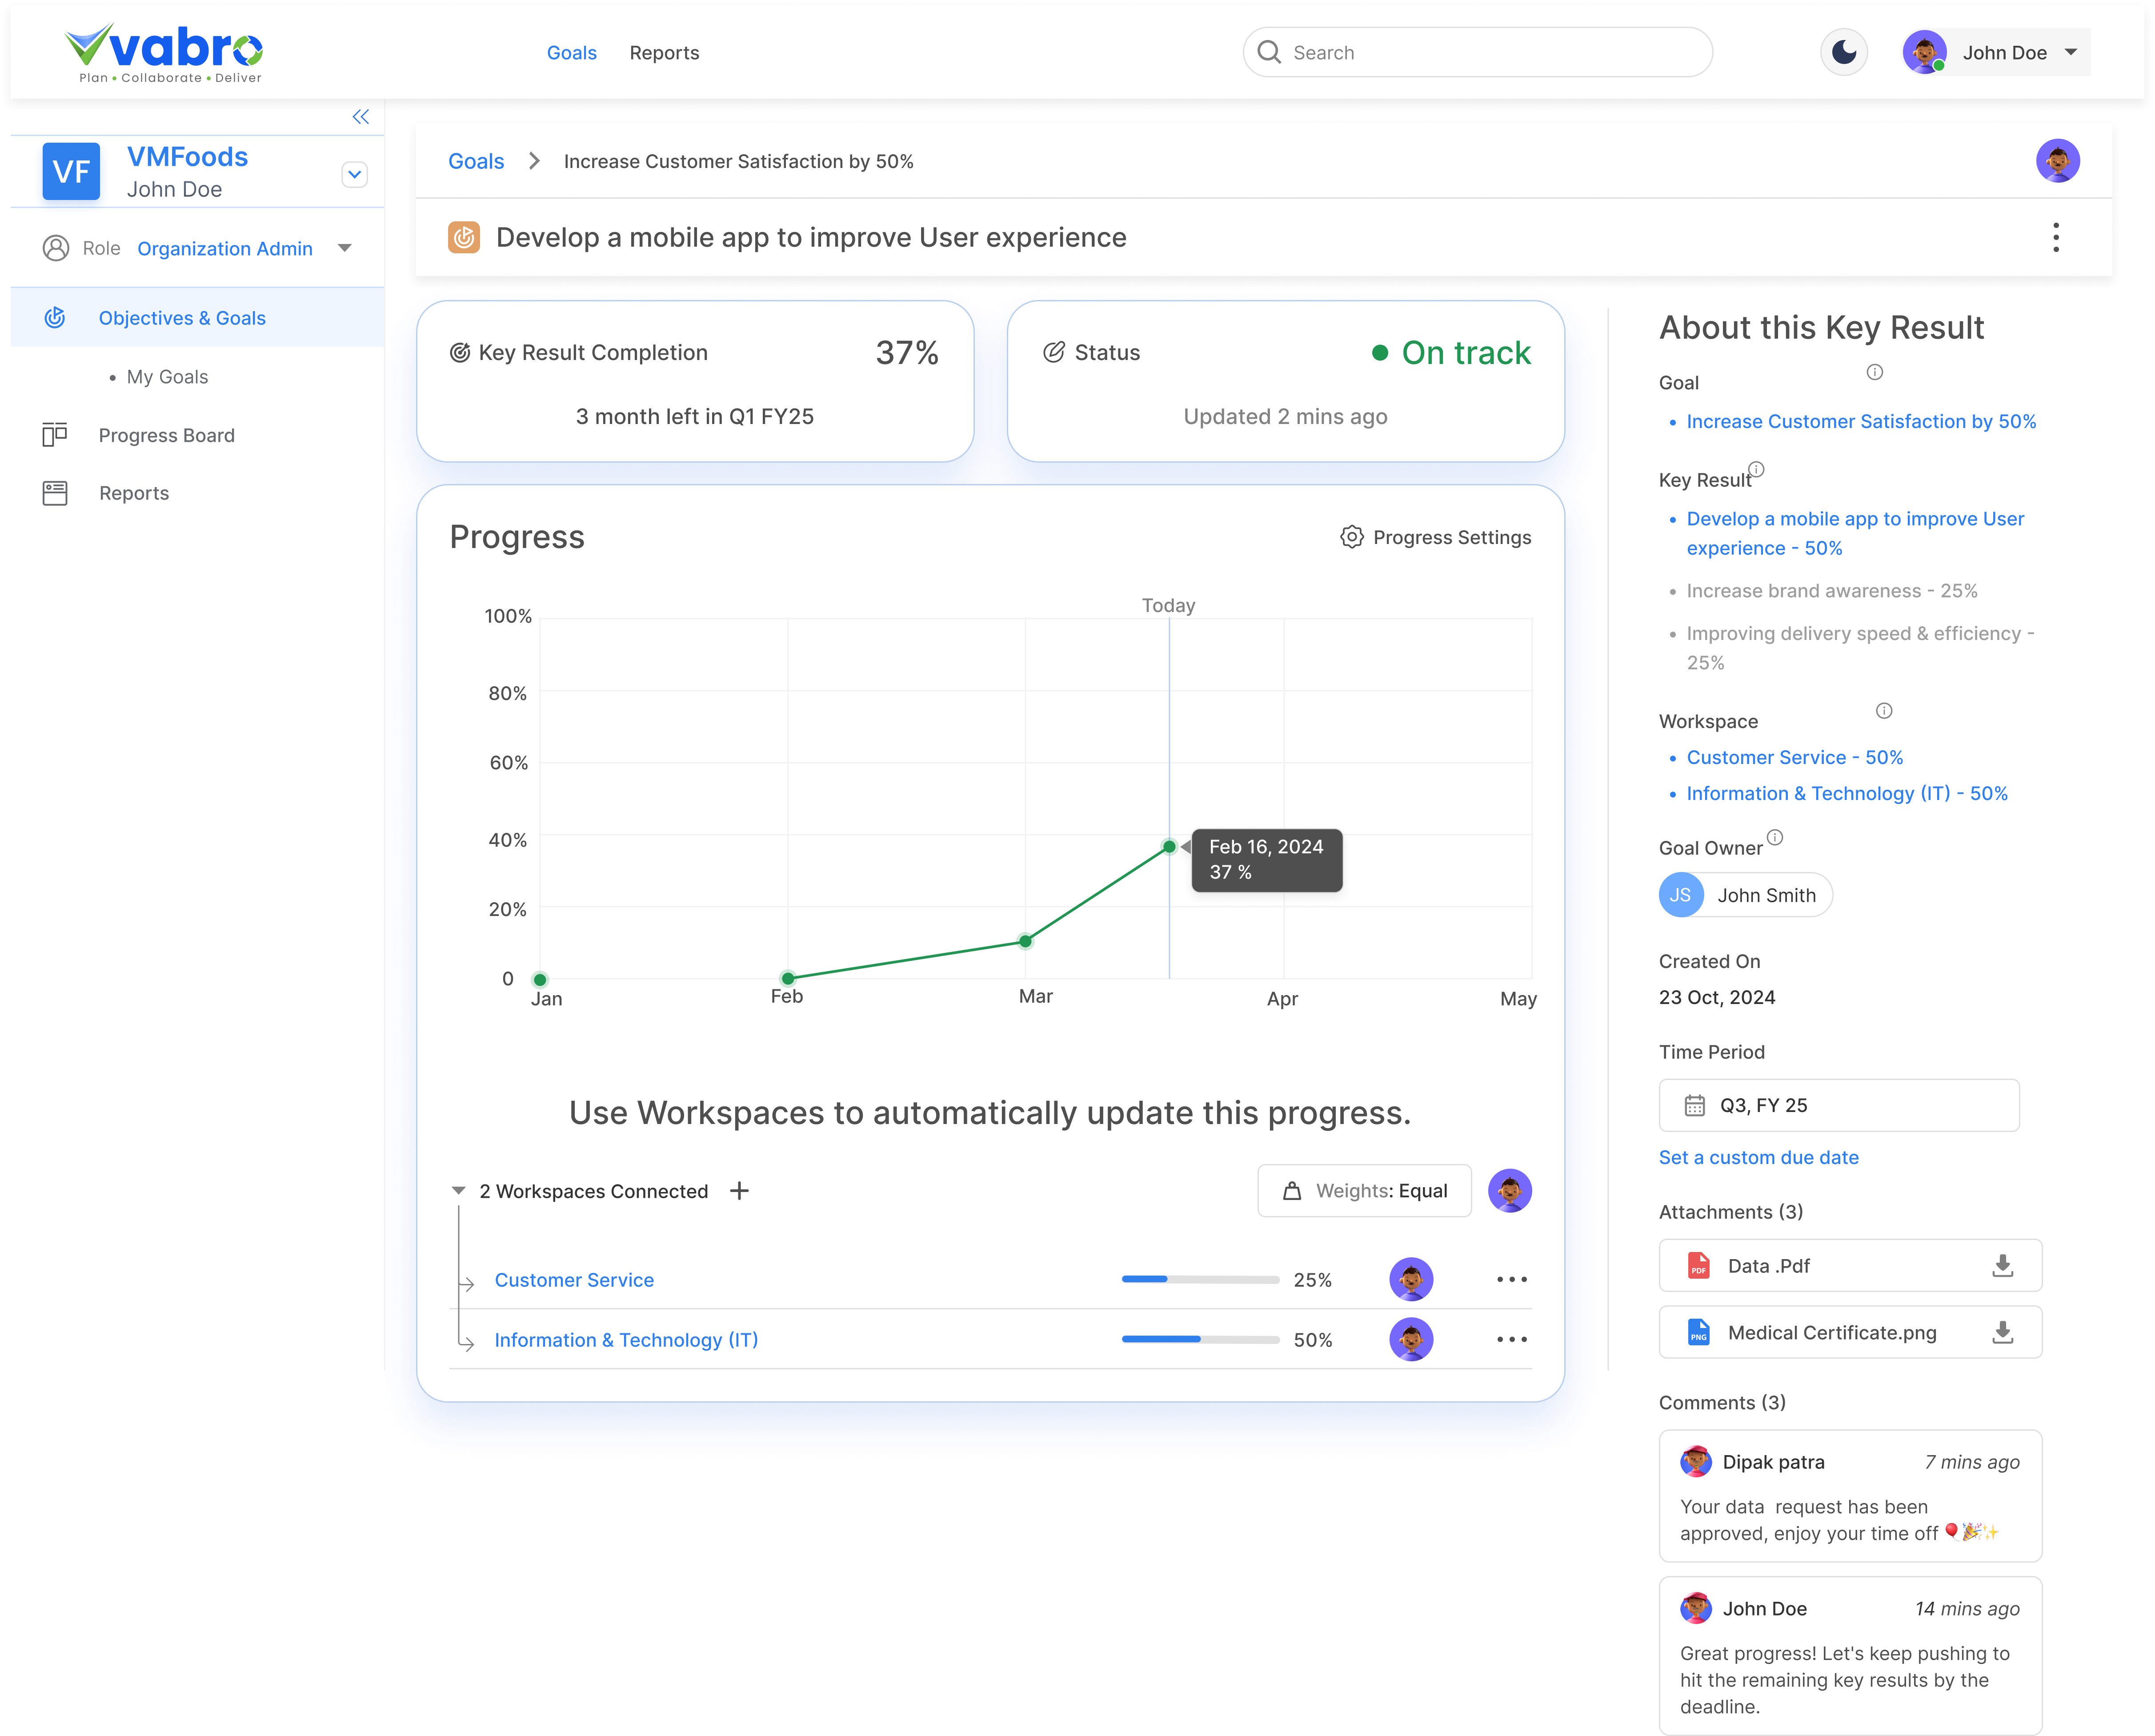
Figure 5.1: Key Result Progress Report (Source: Vabro)
Figure 5.1 above shows a Vabro dashboard displaying OKR progress report, including goal completion percentages, key result breakdowns, and visual graphs indicating overall achievement trends.
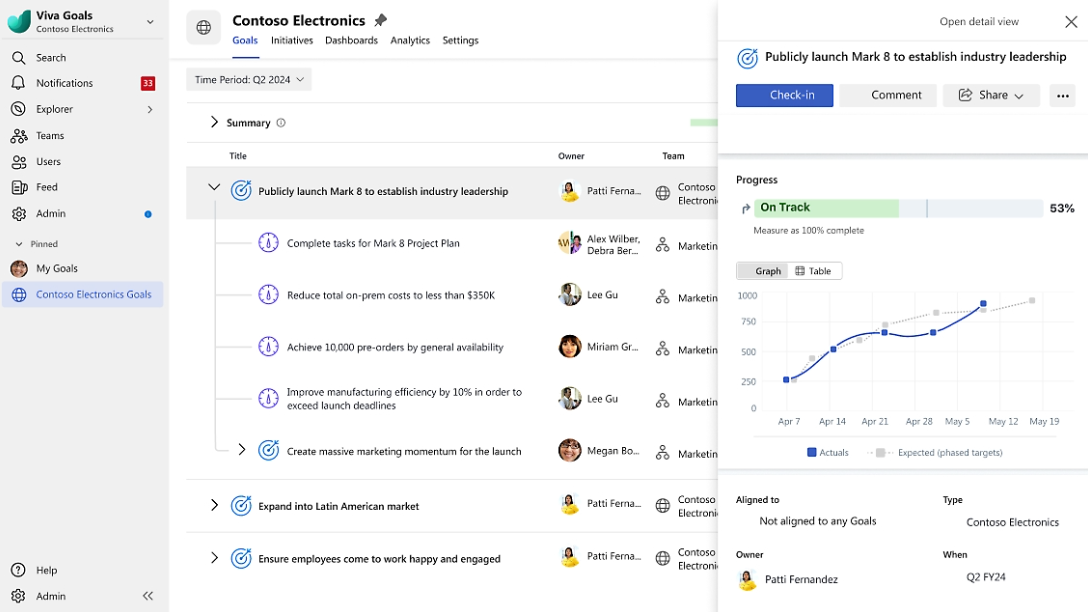
Figure 5.2: Goals Progress Report (Source: Microsoft Viva)
Figure 5.2 above depicts Microsoft Viva Goals dashboard presenting a progress report containing goal completion percentages, individual key result progress, and a summary of team-wide objective performance.
Here are some main components and details that are often included in an OKR progress report:
-
Summary of Objectives
- Objective Overview: A brief description of each objective for the current OKR cycle.
- Objective Status: A simple status indicator (e.g., red, yellow, green) showing whether the objective is on track, at risk, or off track.
-
Key Results and Their Status
- Key Result Details: A breakdown of each key result associated with the objective.
- Progress: The current progress percentage (e.g., 40% completed) or a qualitative assessment (e.g., 3/5 milestones achieved).
- Status Indicator: Similar to the objective status, each key result can be marked with a color or symbol (e.g., red, yellow, green) to indicate whether it's on track or needs attention.
-
Progress Against KPIs or Metrics
- Quantitative Metrics: If the key results are tied to specific numbers (e.g., revenue growth, user acquisition), you would include the latest performance against those metrics.
- Graphical Representation: Charts or graphs that show progress over time, helping to visually capture trends and changes.
-
Achievements and Milestones
- Completed Key Results: Highlight key results or milestones that have been fully achieved during the reporting period.
- Completed Tasks: Significant tasks or projects that have contributed to the completion of a key result.
-
Challenges and Obstacles
- Roadblocks: Describe any issues or challenges that have impeded progress, such as resource constraints, dependencies on other teams, or external factors.
- Action Plans: Outline steps that are being taken to overcome these challenges or any changes in strategy.
-
Adjustments or Changes
- Revised Key Results: If some key results are unrealistic or need adjustment, this section will show the modifications made (e.g., adjusting metrics, changing deadlines).
- Shifts in Strategy: If any shifts in strategy are required to stay aligned with the objective, these will be outlined here.
-
Next Steps
- Immediate Actions: A summary of the tasks and actions the team will focus on in the next reporting period to ensure continued progress.
- Milestones for the Next Period: Specific targets or dates when key results should be achieved.
-
Overall Progress Rating
- Percentage Completion of OKRs: An aggregate measure of the progress across all objectives and key results. This could be calculated based on the completion percentage of each key result.
- Reflection and Learnings: A quick reflection on what’s been working and what could be improved for the next cycle.
Example of an OKR Status Report (Overview)
Objective: Increase Customer Satisfaction (Q1 2025)
Key Results:
- KR1: Improve NPS score from 60 to 75 – 50% complete (NPS increased to 68)
- KR2: Launch a new customer support portal – 100% complete (Launched)
- KR3: Resolve 90% of support tickets within 24 hours – 70% complete
Achievements:
- Launched the customer support portal ahead of schedule.
- Improved internal processes, resulting in a 10% increase in support ticket resolution speed.
Challenges:
- The NPS score improvement is slower than expected due to delayed customer feedback collection.
Action Plans:
- Plan to expedite customer feedback collection via surveys.
- Focusing on faster response times for support tickets.
Next Steps:
- Aim to achieve a 5% improvement in NPS by end of Q1.
- Continue to monitor support ticket resolution times closely.
Overall OKR Status: On Track (70% of KR goals achieved so far)