1.Objective Overview: The dashboard typically starts with an overview of the high-level objectives. Each objective will usually have:
- Objective Name/Title: A clear, concise description of the objective.
- Objective Status: A visual indicator (e.g., color-coded) of whether the objective is on track, at risk, or off track.
- Progress Indicator: A bar, percentage, or score showing how much progress has been made toward the objective.
-
Example:
- Objective: "Increase brand awareness."
- Progress: 70% complete (based on key results' performance).
Figures 4.13 to 4.16 show typical dashboards in AI-enabled digital OKR tools:
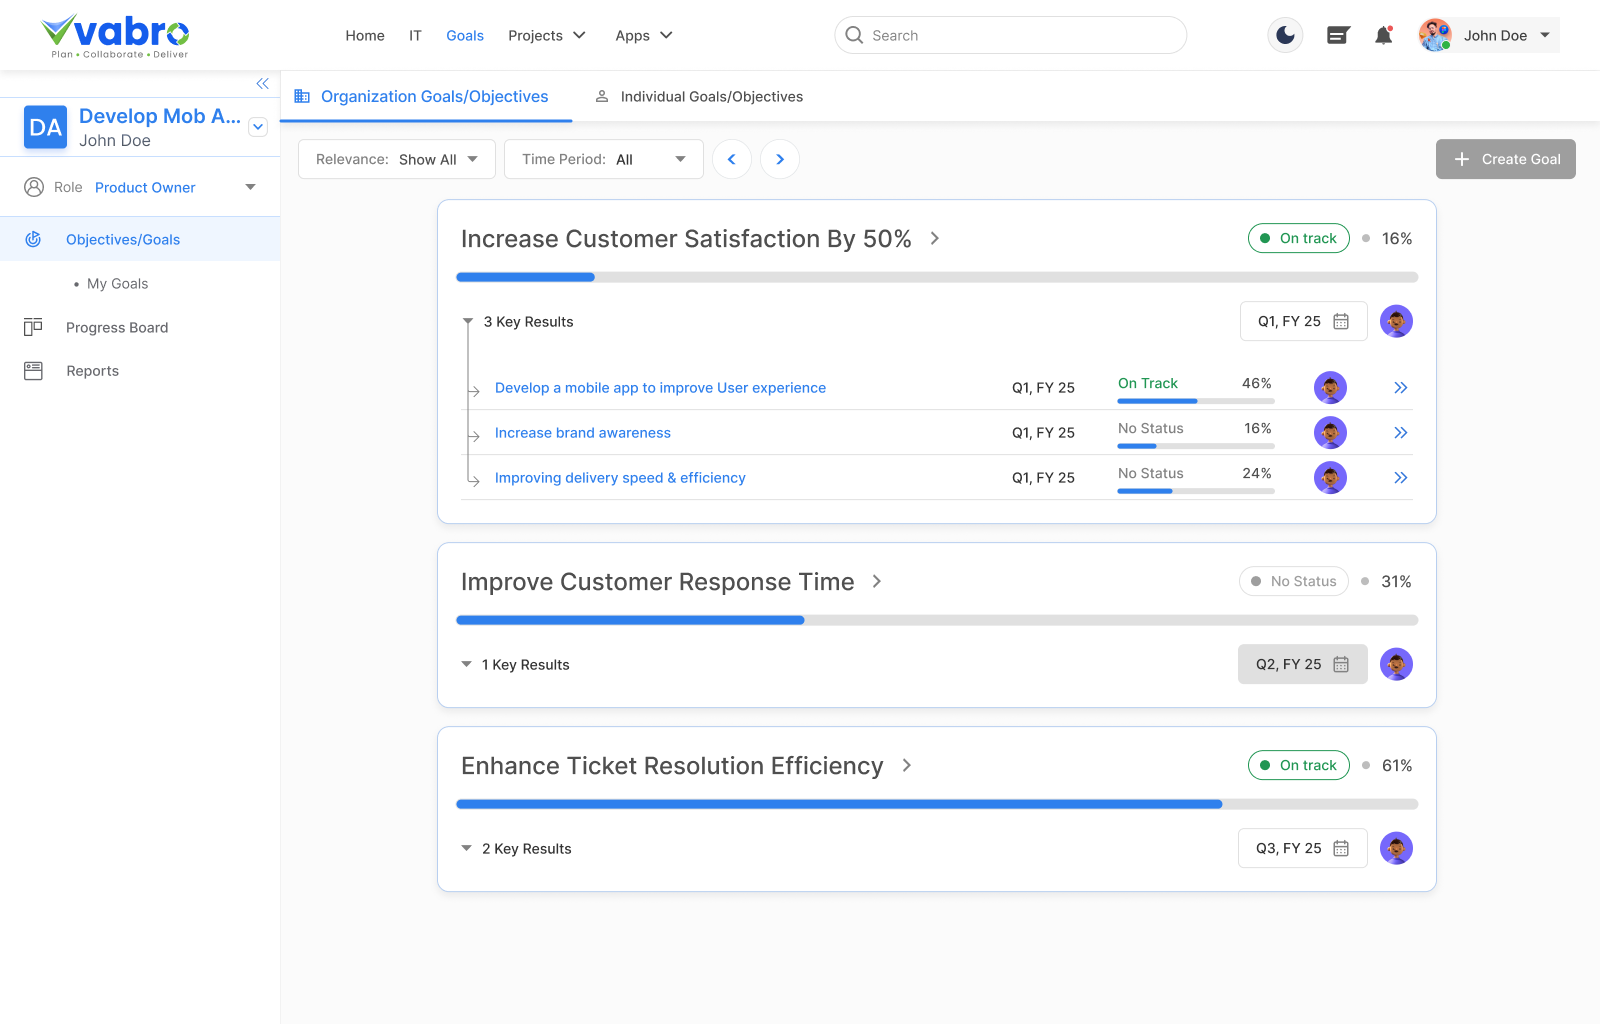
Figure 4.13: Sample OKR Dashboard (Source: Vabro)
Figure 4.13 above shows an OKR dashboard in Vabro capturing the goal Increase Productivity Using Figma by 50%. It tracks the Build Design System key result, currently at 0% completion. Users can connect User Stories/Task Groups to automatically update progress. The right panel displays goal details, owner, attachments, and comments.
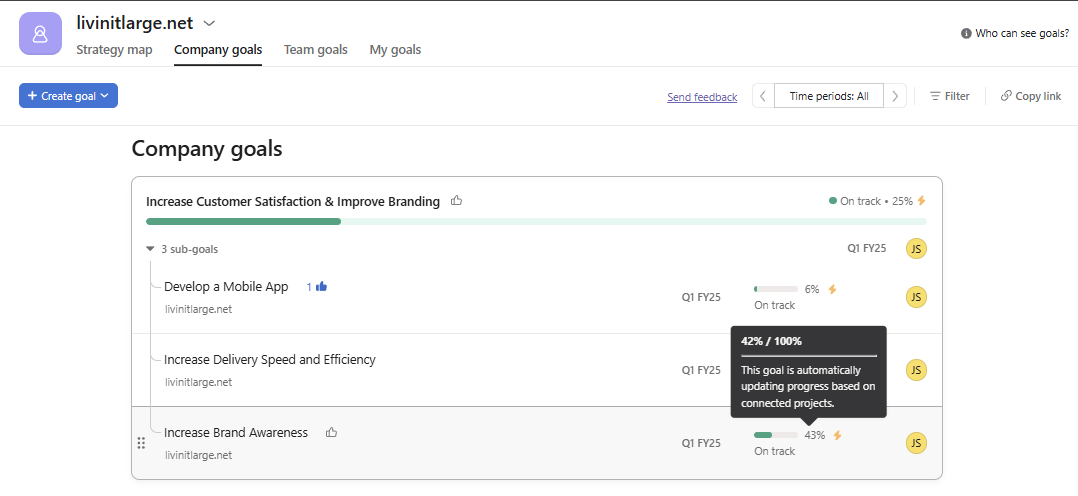
Figure 4.14: Sample OKR Dashboard (Source: Asana)
Figure 4-14 above displays an OKR dashboard of Asana. It shows task progress, timelines, and team collaboration, and integration of OKR management with broader workflows.
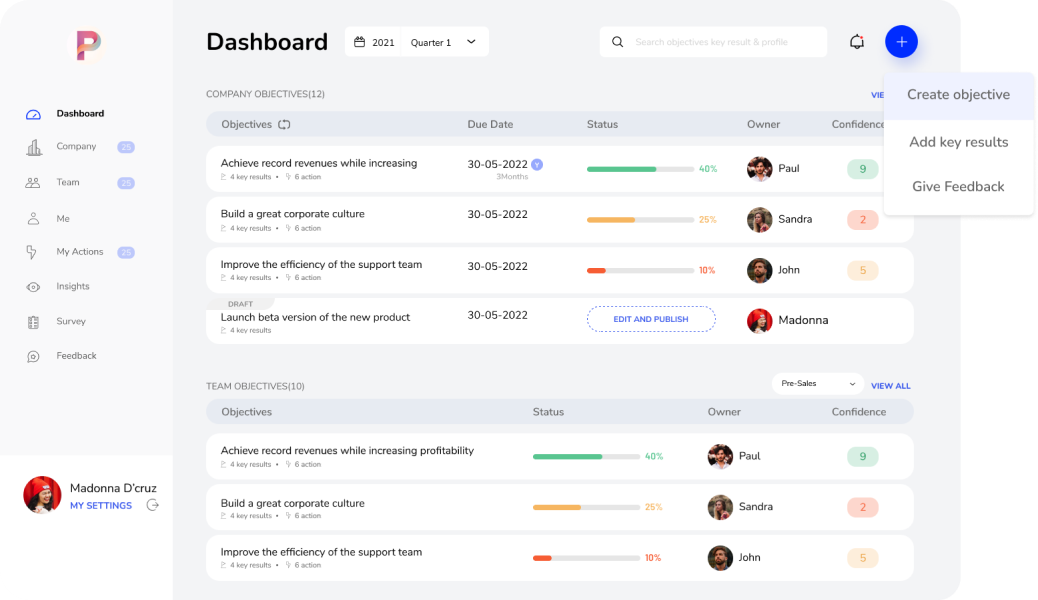
Figure 4.15: Typical OKR Dashboard (Source: JOP)
Figure 4.15 above displays an OKR dashboard of Joy of Performing (JOY). It showcases objectives, key results, confidence ratings, and progress percentages, enhancing team productivity and performance alignment.
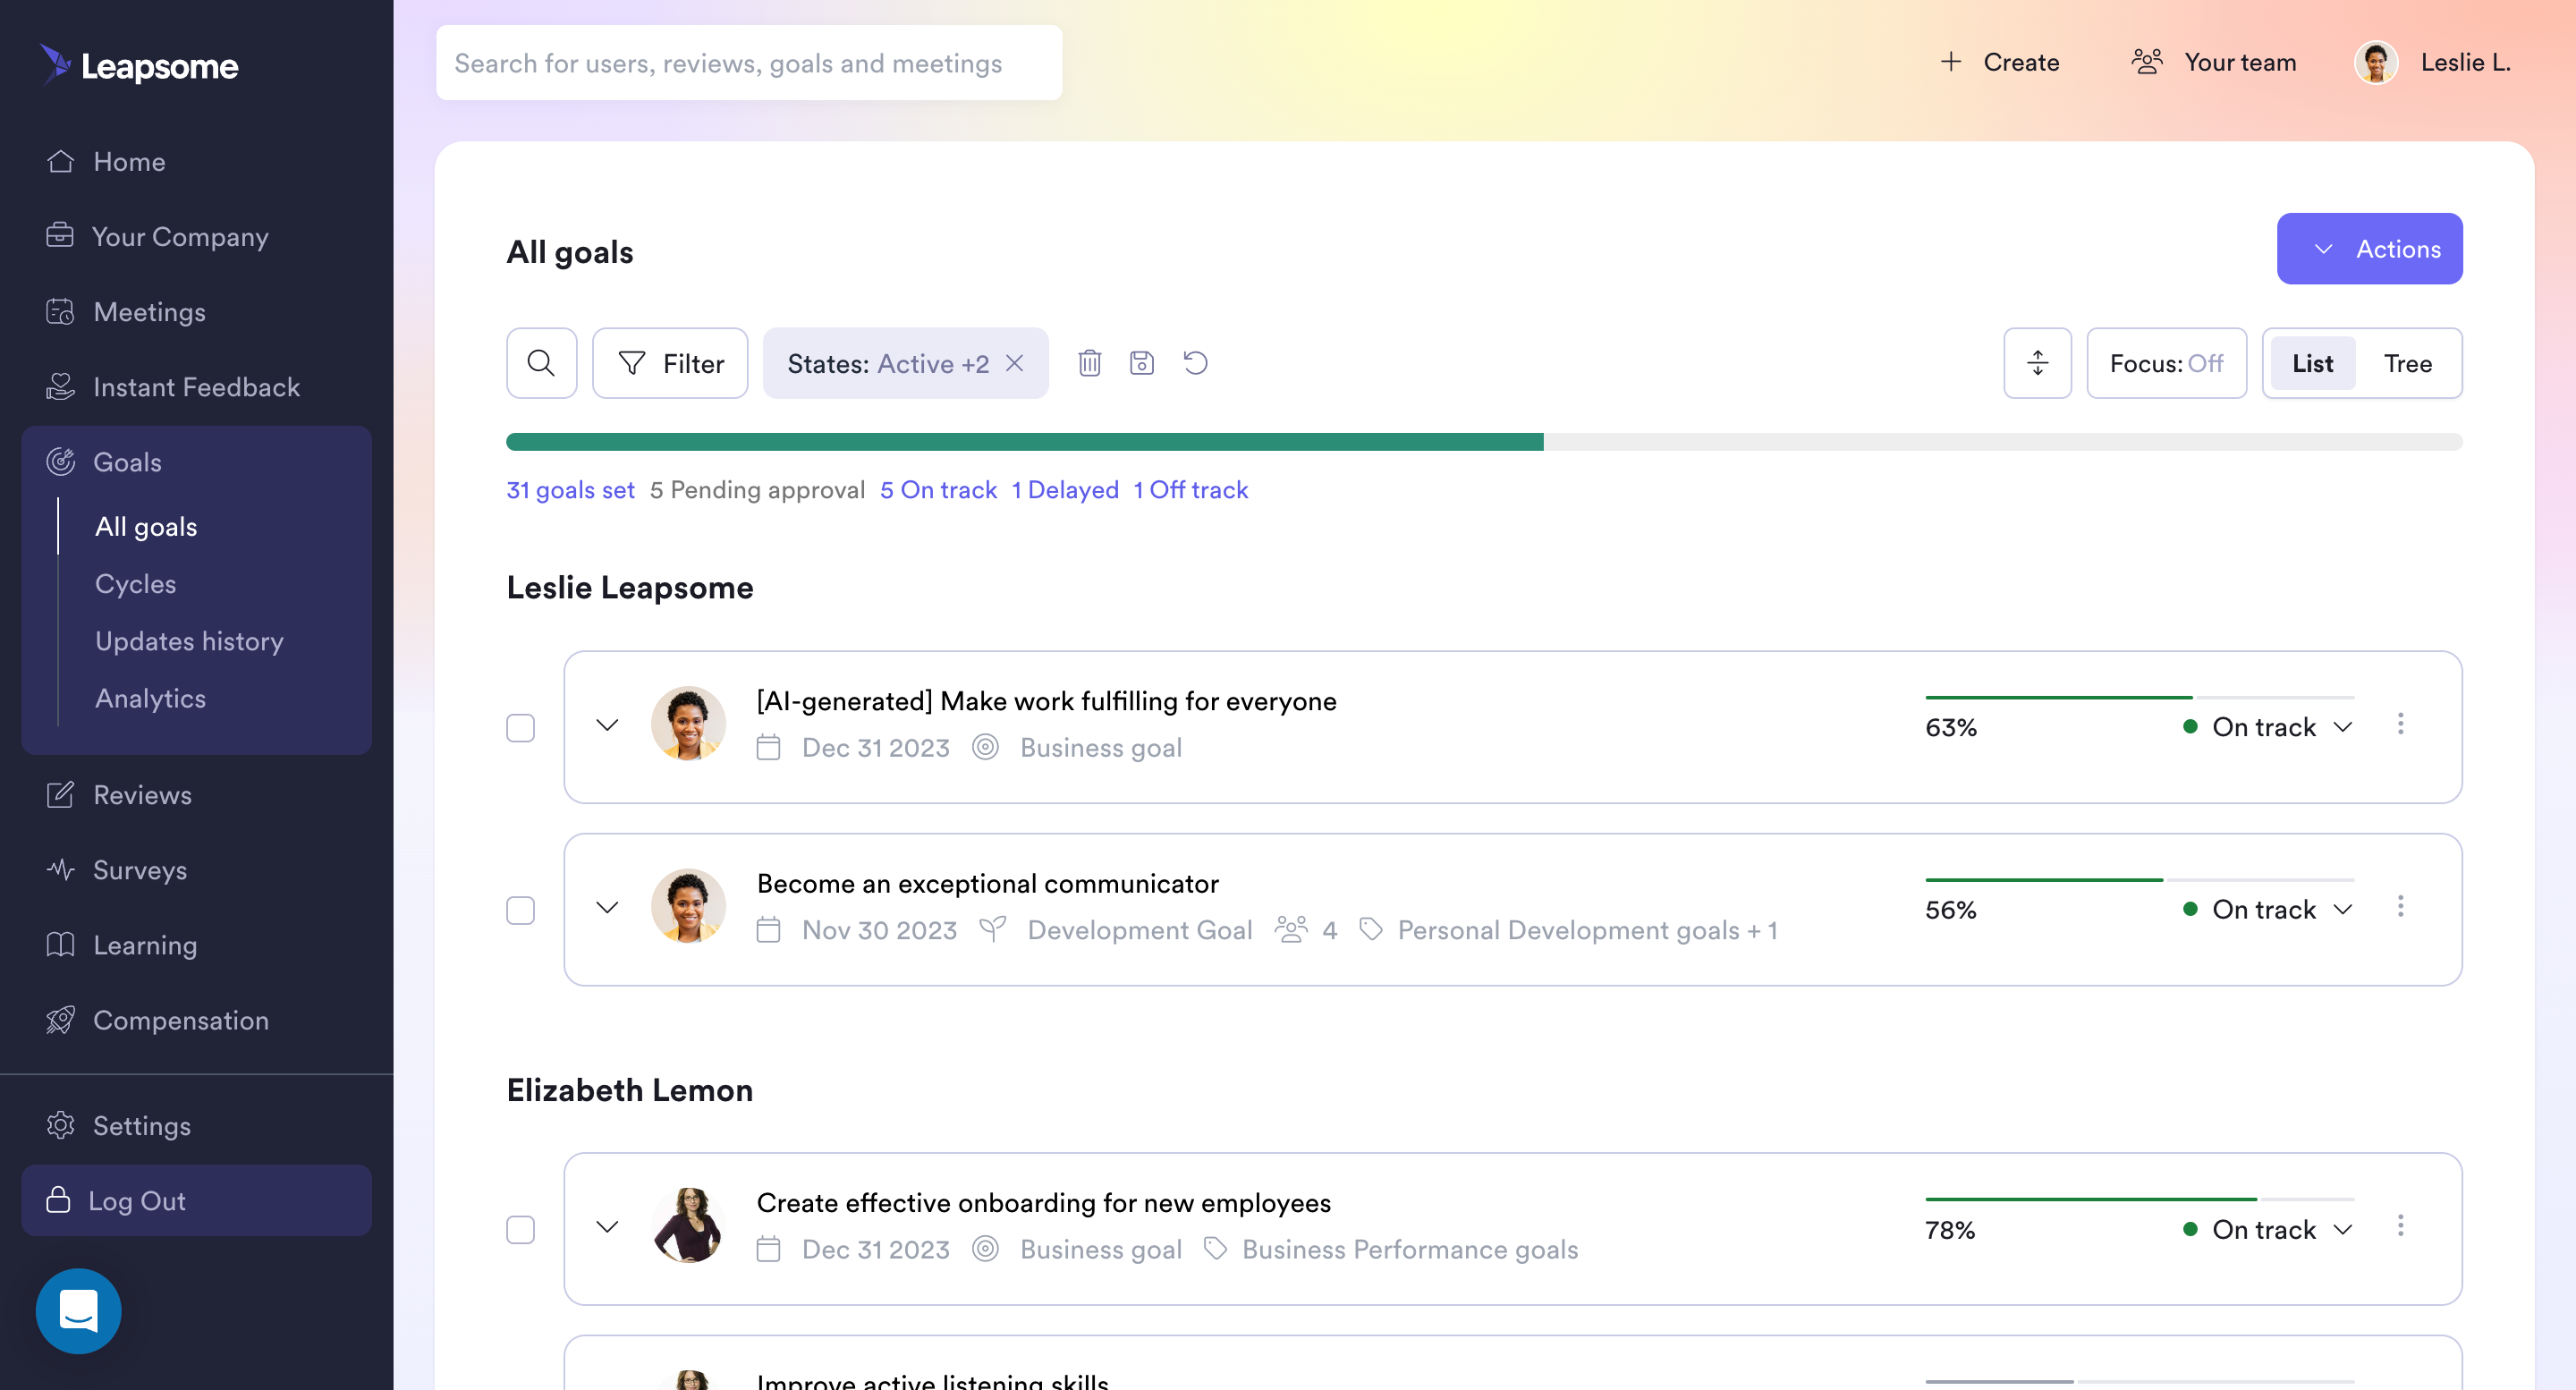
Figure 4.16: Standard OKR Dashboard (Source: Leapsome)
Figure 4.16 above shows an OKR dashboard showing individual and company goals with progress percentages, goal types, deadlines, and status filters, fostering performance management and personal development.
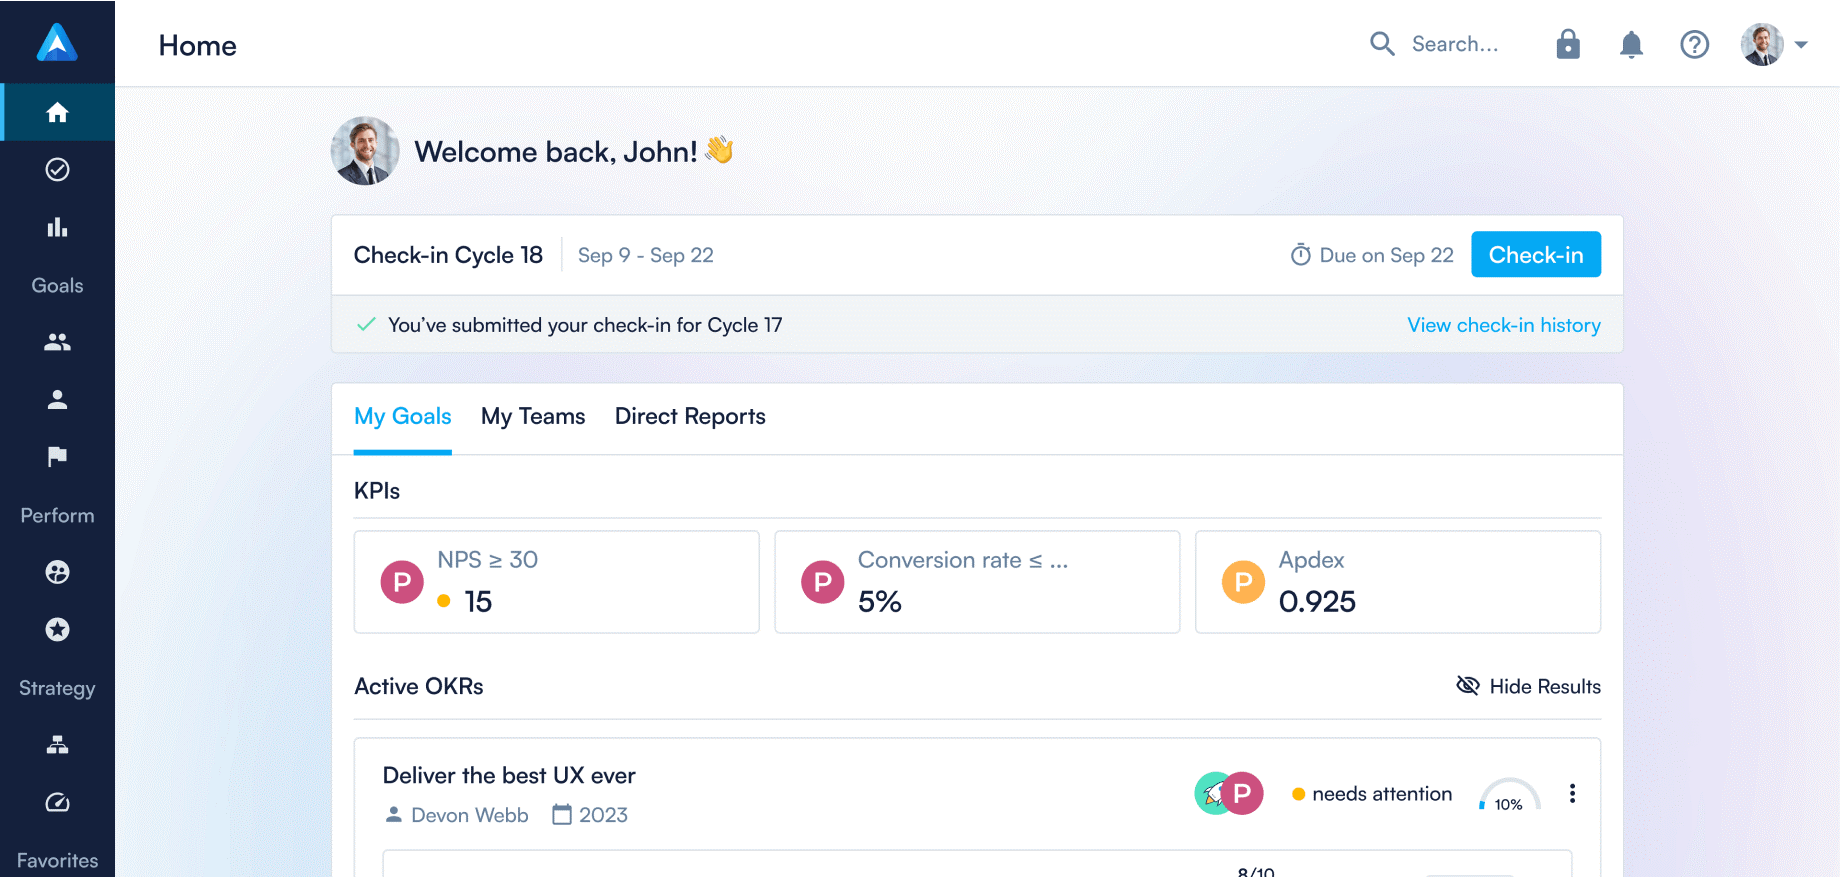
Figure 4.17: Typical OKR Dashboard (Source: Perdoo)
Figure 4.17 above shows a typical OKR dashboard featuring goal tracking, progress updates, and strategy alignment to drive company performance and growth.
2.2. Key Results Tracking: For each objective, the dashboard should display the corresponding Key Results. Key results are tracked individually and shown with:
- Key Result Description: A specific, measurable outcome.
- Progress: A visual representation of progress, such as a percentage or completion score.
- Target: The numeric goal or target that needs to be achieved.
- Actual Value: The current value of the key result (e.g., current traffic, revenue, followers).
- Status: A color-coded indicator (e.g., green = on track, yellow = at risk, red = off track).
-
Example:
- Key Result: "Increase website traffic by 20%"
- Target: 20% increase.
- Actual: 15% increase (Progress: 75% complete).
- Status: Yellow (at risk).
Figures 4.18 to 4.21 shows OKR interfaces in AI-enabled digital OKR tools:
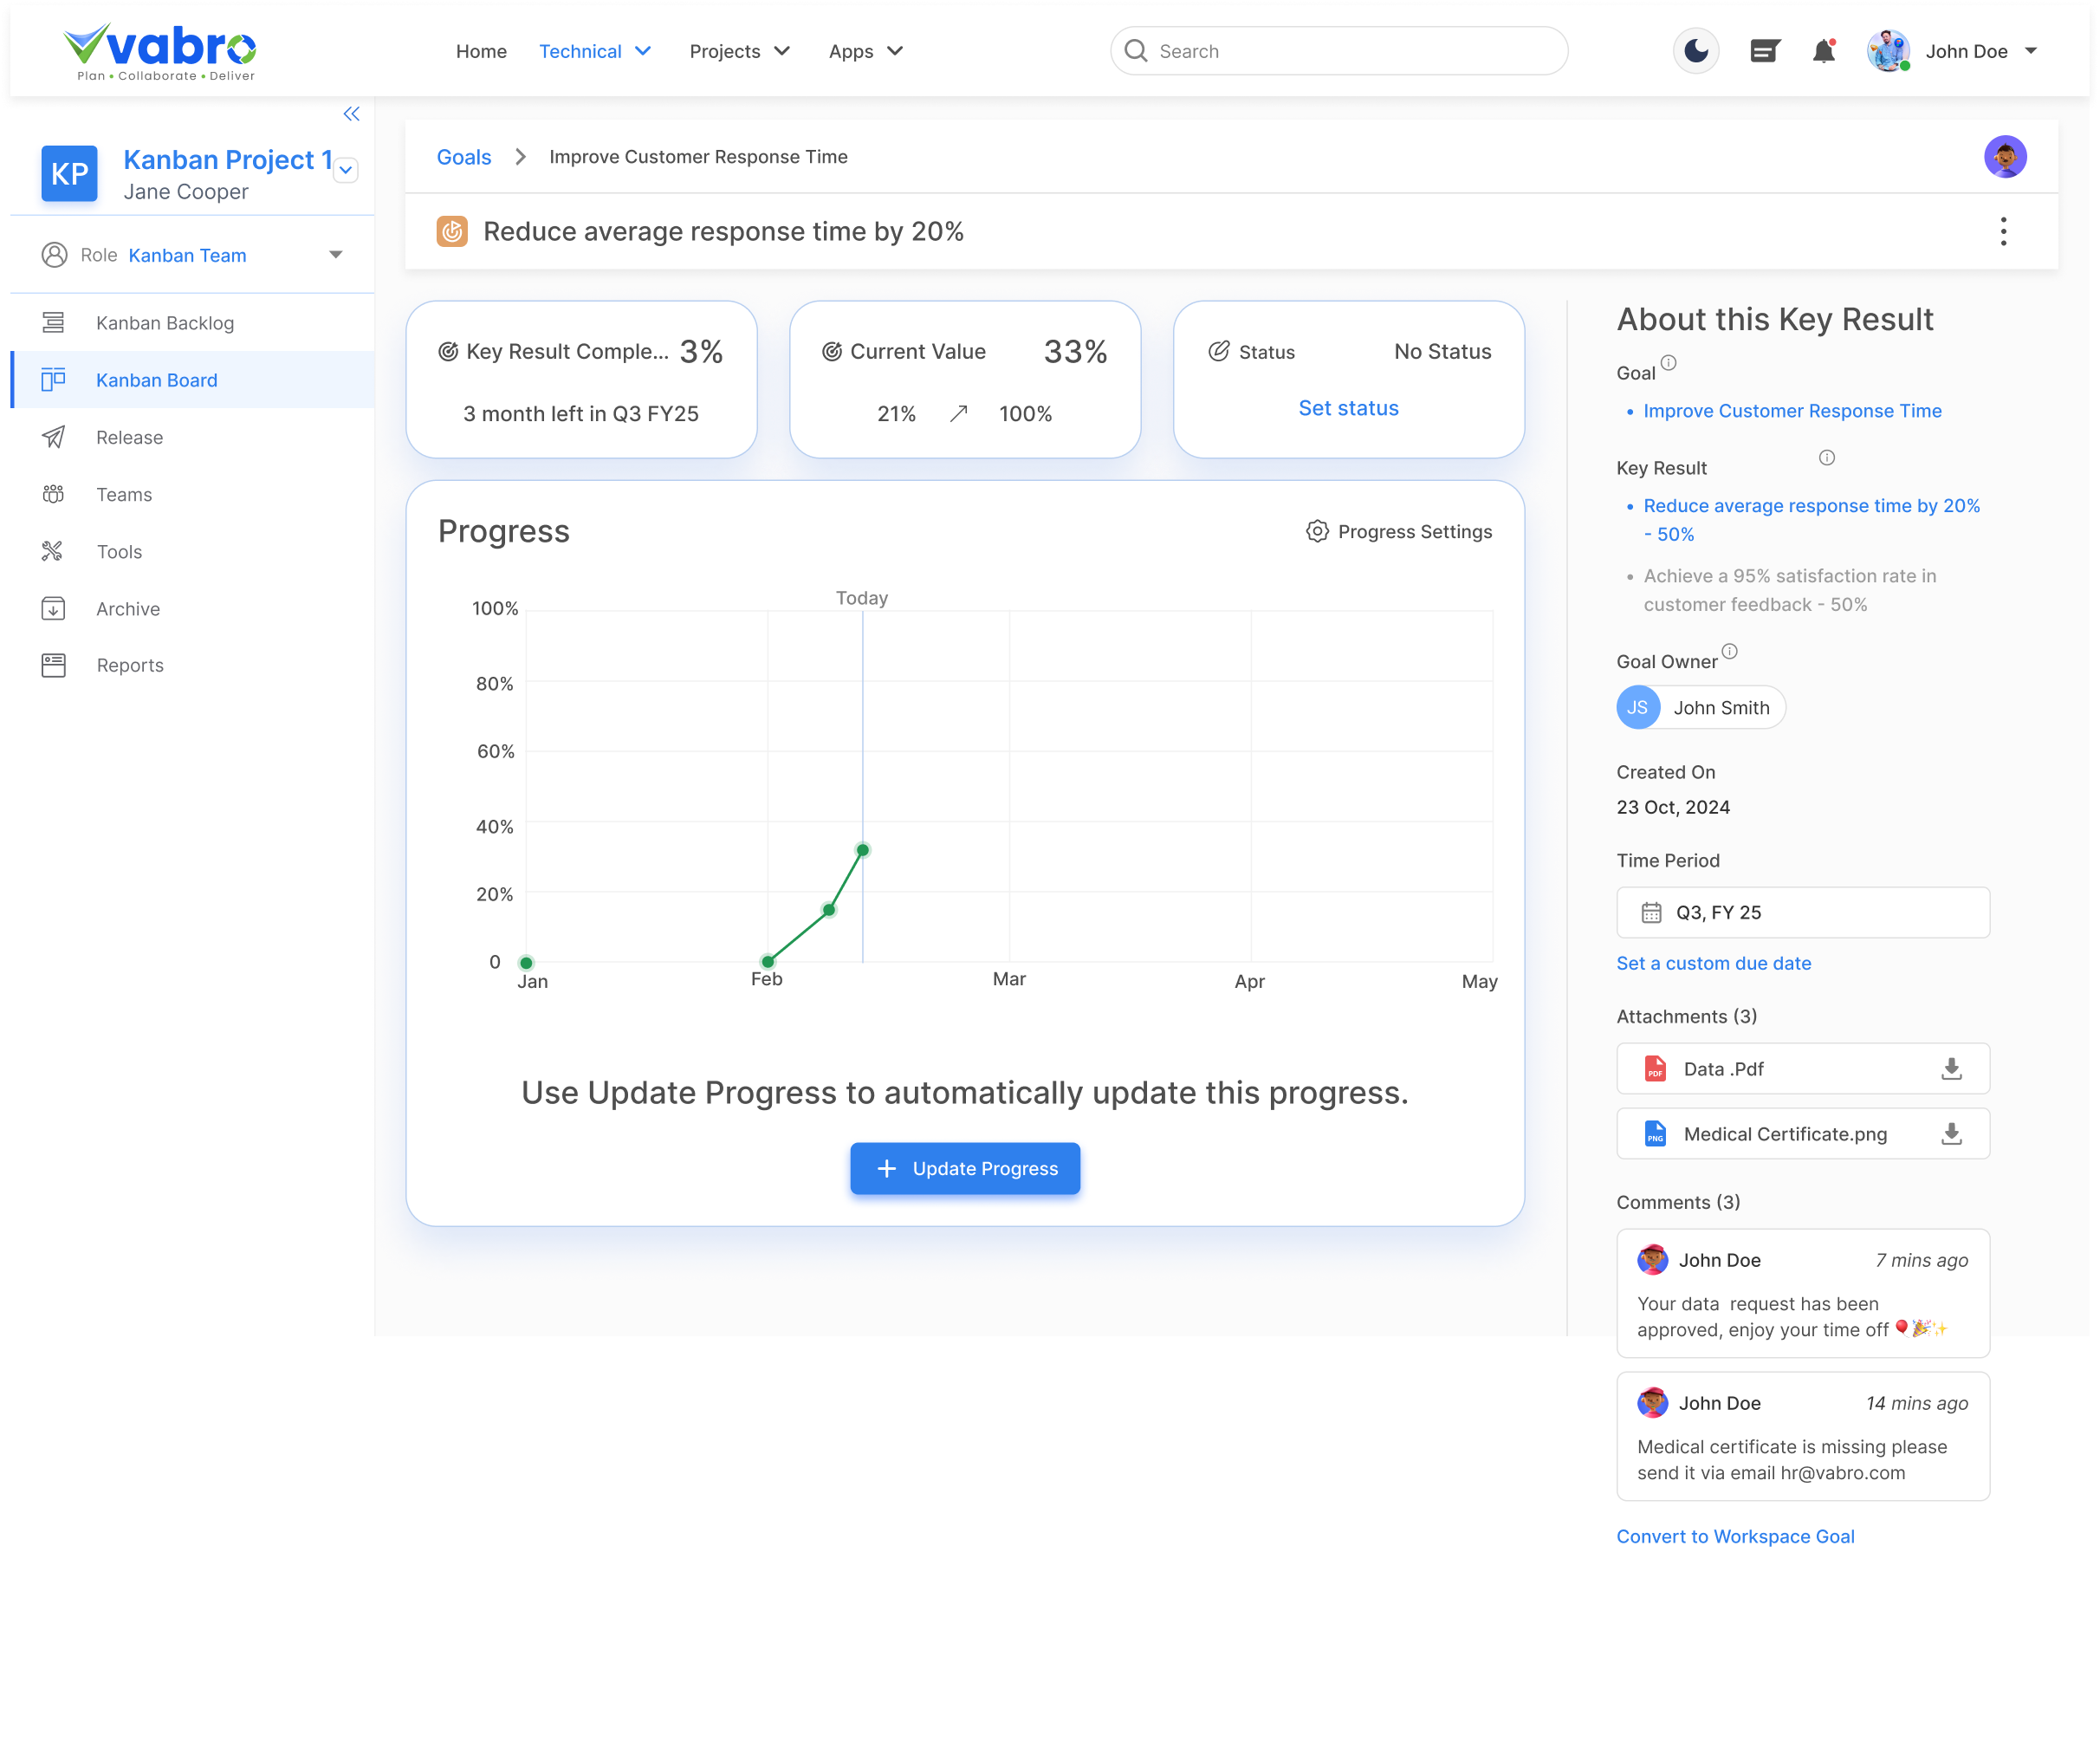
Figure 4.18: Key Results Progress Tracking (Source: Vabro)
Figure 4.18 above shows an OKR tool interface that tracks goal progress with visual charts, custom statuses, and automatic updates. Enables collaboration through attachments, comments, and goal-specific insights.
Figure 4.19: Tracking Progress of OKRs (Source: Profit.co)
Figure 4.19 shows OKR tracking with detailed key result progress, alignment visualization, and individual performance contributions across organizational objectives.
Figure 4.20: OKR Progress Tracking (Source: Quantive)
Figure 4.20 above shows an interface depicting data-driven OKR tracking with automated updates, detailed metrics, and alignment features to improve goal management and performance transparency.
Figure 4.21: OKR Progress Monitoring (Source: Workboard)
Figure 4.21 shows an OKR interface that combines OKR tracking with business outcomes, offering goal visualizations, key result tracking, and performance summaries with collaborative team features.
3.Score/Completion Metrics: At the end of the OKR period (typically at the end of a quarter), the dashboard often includes a score or completion metric for each key result. This is usually based on a scoring system:
- 0.0 to 0.3: Key result was not achieved.
- 0.4 to 0.6: Partial achievement (some progress, but the goal wasn’t fully met).
- 0.7 to 1.0: Full achievement or very close to meeting the goal.
-
Example:
- Key Result: "Increase social media followers by 30%" (Score: 0.9).
4.Visualization of Progress: A good OKR dashboard often includes graphical elements to help visualize progress more easily. These visuals might include:
- Progress Bars: Display the percentage of completion for each key result.
- Pie Charts: Show overall achievement versus the target.
- Heatmaps: Use color coding to indicate whether key results are on track.
- Gantt Charts/Timelines: Track the timeline for each key result and show how the team is progressing over time.
5.Alignment with Organizational Goals: A good OKR dashboard will show how team or individual OKRs align with larger organizational or departmental OKRs. This ensures that teams are focused on priorities that contribute to the company’s success.
- Example: The dashboard might show that the objective to “Increase brand awareness” aligns with the larger organizational goal of expanding market reach.
6.Updates and Changes: The dashboard should include a section to document any updates or adjustments made to OKRs over time. This helps maintain transparency, particularly if key results were modified or new actions were taken.
- Example: "Key result 1 adjusted to 15% increase in website traffic instead of 20% due to recent SEO changes."
7.Actionable Insights and Alerts: Many OKR dashboards come with alerts or notifications to flag areas where progress is off-track. These can be automatic or manually set.
- Red Flags: If a key result is lagging behind, a notification or alert might be triggered.
- Action Items: Dashboards may allow users to assign or track action items to correct course if a result is at risk.